
Research
Tropical climate variability
Tropics-wide intraseasonal oscillations (Bao et al. 2025 PNAS)
Tropical climate variability is shaped by a range of oscillations, but most known modes influencing the tropical mean state occur on seasonal or interannual timescales. Here, we identify a pronounced tropics-wide intraseasonal oscillation (TWISO) with a 30 to 60-days period, evident in satellite observations and reanalysis data. TWISO emerges across multiple variables and reflects dynamic interactions among convection, radiation, and large-scale circulation. Its widespread expression suggests substantial impacts on tropical weather and climate at regional scales.
Convective organisation and precipitation extremes
Tropical precipitation extremes are projected to intensify in a warmer climate, but it is unclear what processes can regulate precipitation extremes. With a new generation of models (global storm-resolving model), ones that explicitly represent the transient dynamics of convective storms, this study highlights the importance of spatial clustering of convection at mesoscale, a process that is not resolved by conventional global climate models, to influence how precipitation extremes will change with warming. When convective storms are more clustered, tropical precipitation extremes increase with storms being less numerous but larger in size. Furthermore, the results indicate that potential possibility of strong intensification of the heaviest rainfall as climate warms is related to this mesoscale process.
The impacts of convective self-aggregation on extreme precipitation and updraft velocity are investigated by using the Weather Research and Forecasting Model in the idealized setting of radiative-convective equilibrium with a 3-km horizontal resolution. The results show that convective self-aggregation has a negligible impact on extreme instantaneous precipitation, but extreme daily precipitation increases significantly with increased aggregation. Extreme instantaneous precipitation is more sensitive to microphysical processes, while extreme daily precipitation is more sensitive to the degree of aggregation
Tropical temperature and lapse rates
Zonal Temperature Gradients in the Tropical Free Troposphere (Bao et al. 2022 J. Clim.)
We analyse ERA5 reanalysis data and discover that there exist substantial zonal temperature gradients in the tropical free troposphere. This contradicts the conventional understanding that the tropical free-tropospheric temperature is spatially uniform with weak temperature gradients.
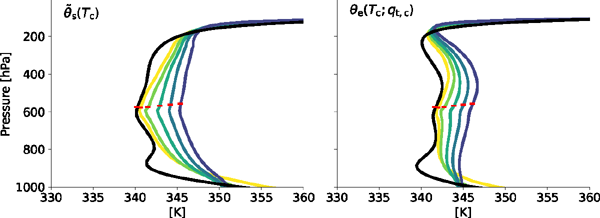
By combining theoretical understanding of tropical thermal structure with data analysis using observations and global storm-resolving models (GSRMs), We find that the tropical atmosphere in saturated convective regions tends to adopt a thermal structure that is isentropic below the zero-degree isotherm and pseudo-adiabatic above it. However, the tropical mean temperature is substantially colder and is set by the bulk of convection, which is affected by entrainment in the lower troposphere.